Altas Instructor Profile
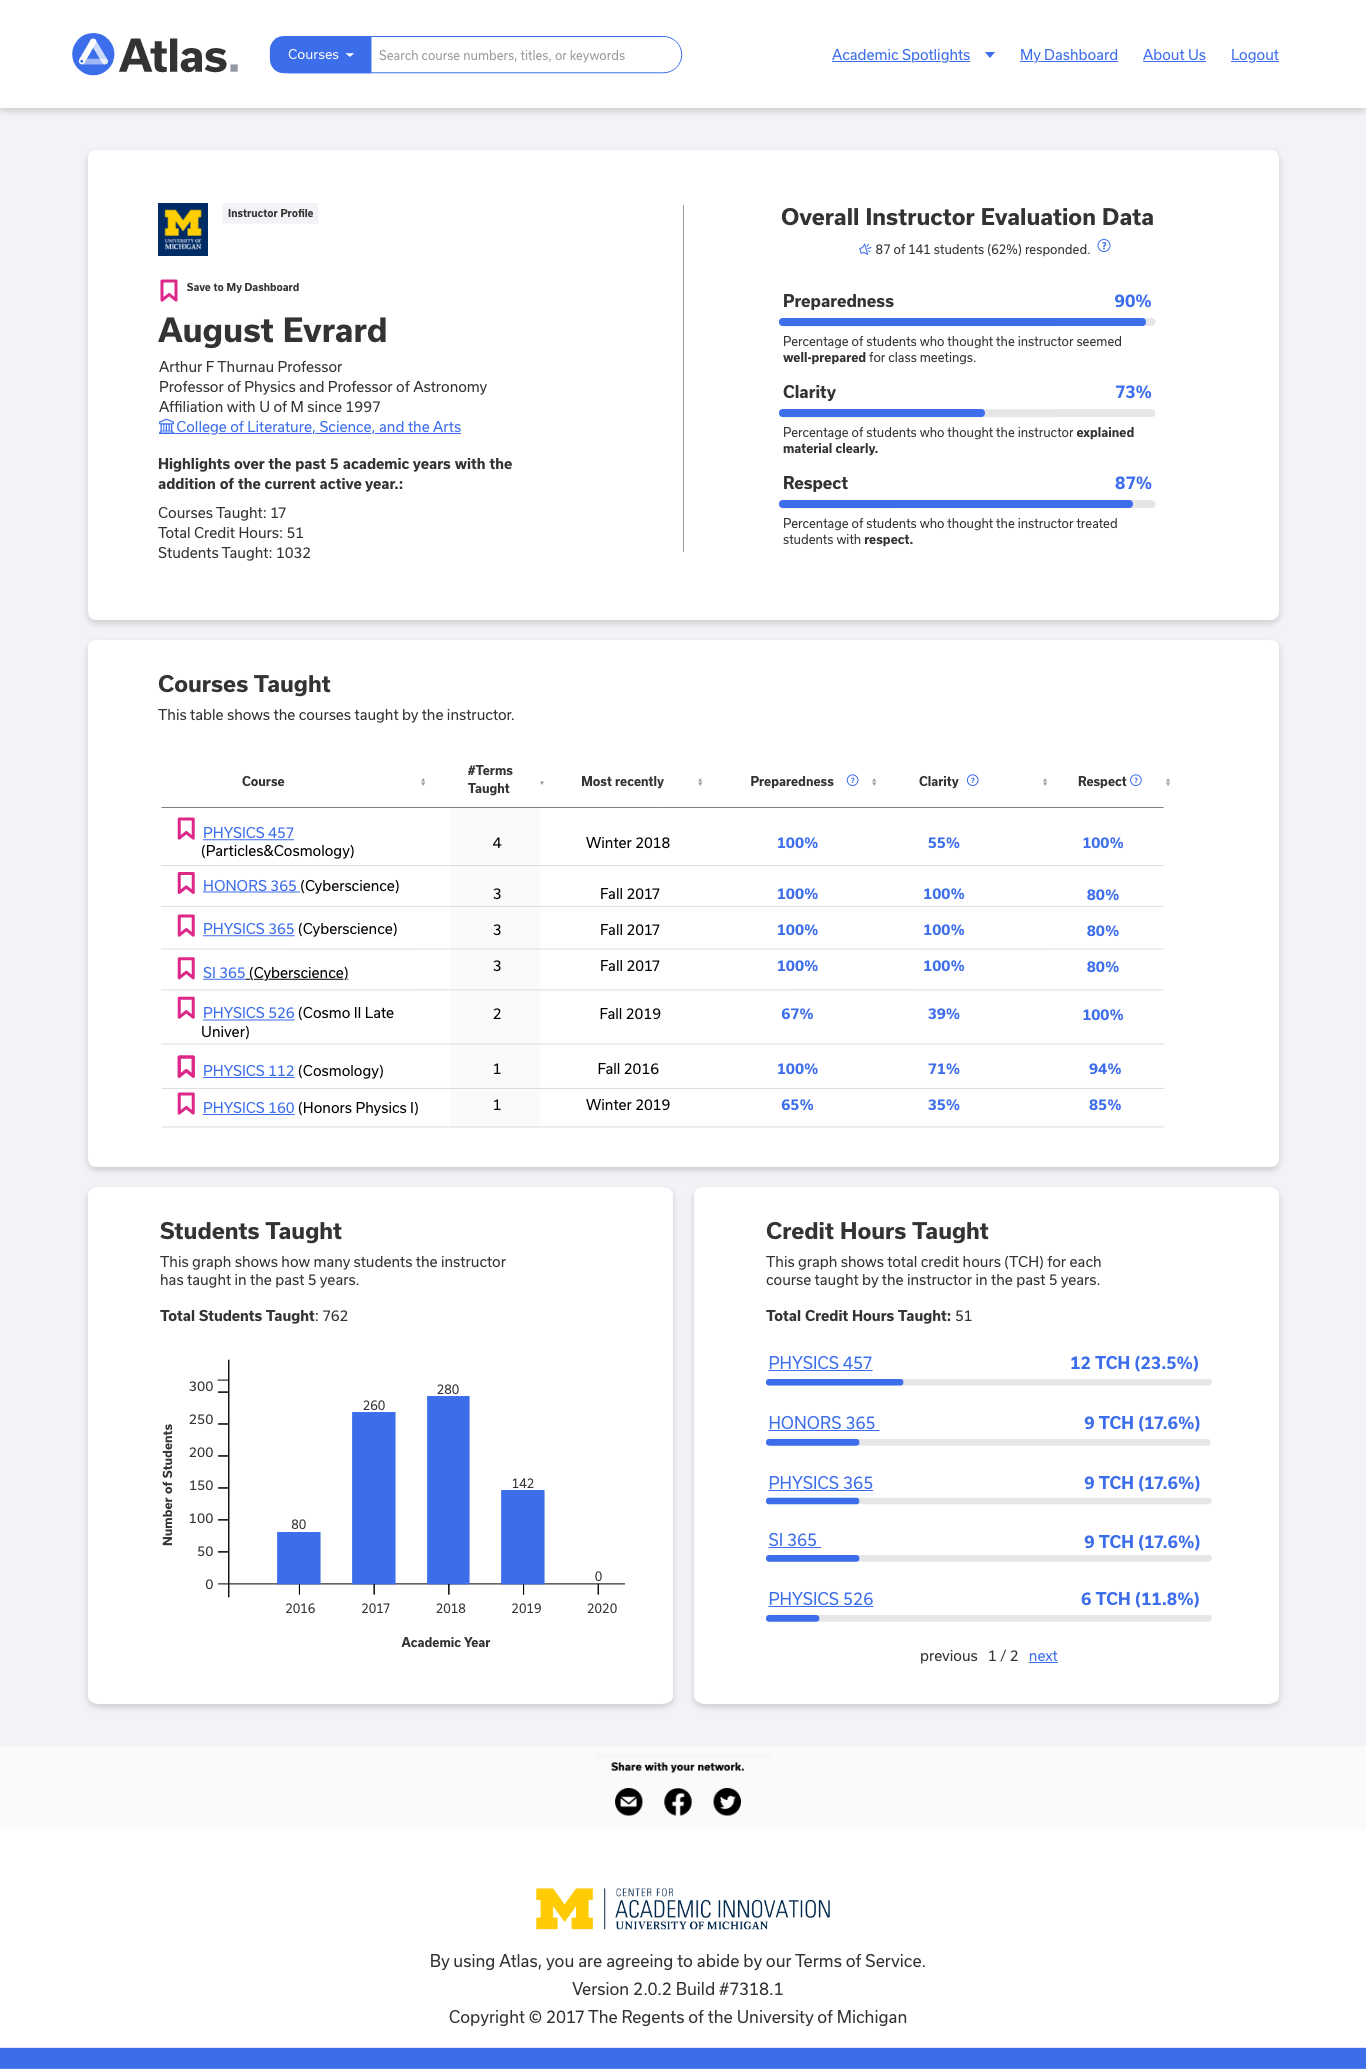
Updated Altas Instructor Profile page based on the users' needs and business requirements
UX Design
UX Research
Web Design
Prototyping


Project Overview
Duration: November 2020 - December 2020
Role: UX Project Lead
Employer: University of Michigan Center for Academic Innovation (CAI)
Skills: UX Design, UX Research, Web Design, Prototyping, Interaction Design, Leadership
Tools: Adobe XD, Trello
Introduction
About Atlas
Atlas is a web application that displays historical data about the University of Michigan curriculum and courses to help students, faculty, and staff in decision making. More than 85% of UM students use Atlas, and there are over 9,000 weekly active users.
Problem & Challenge
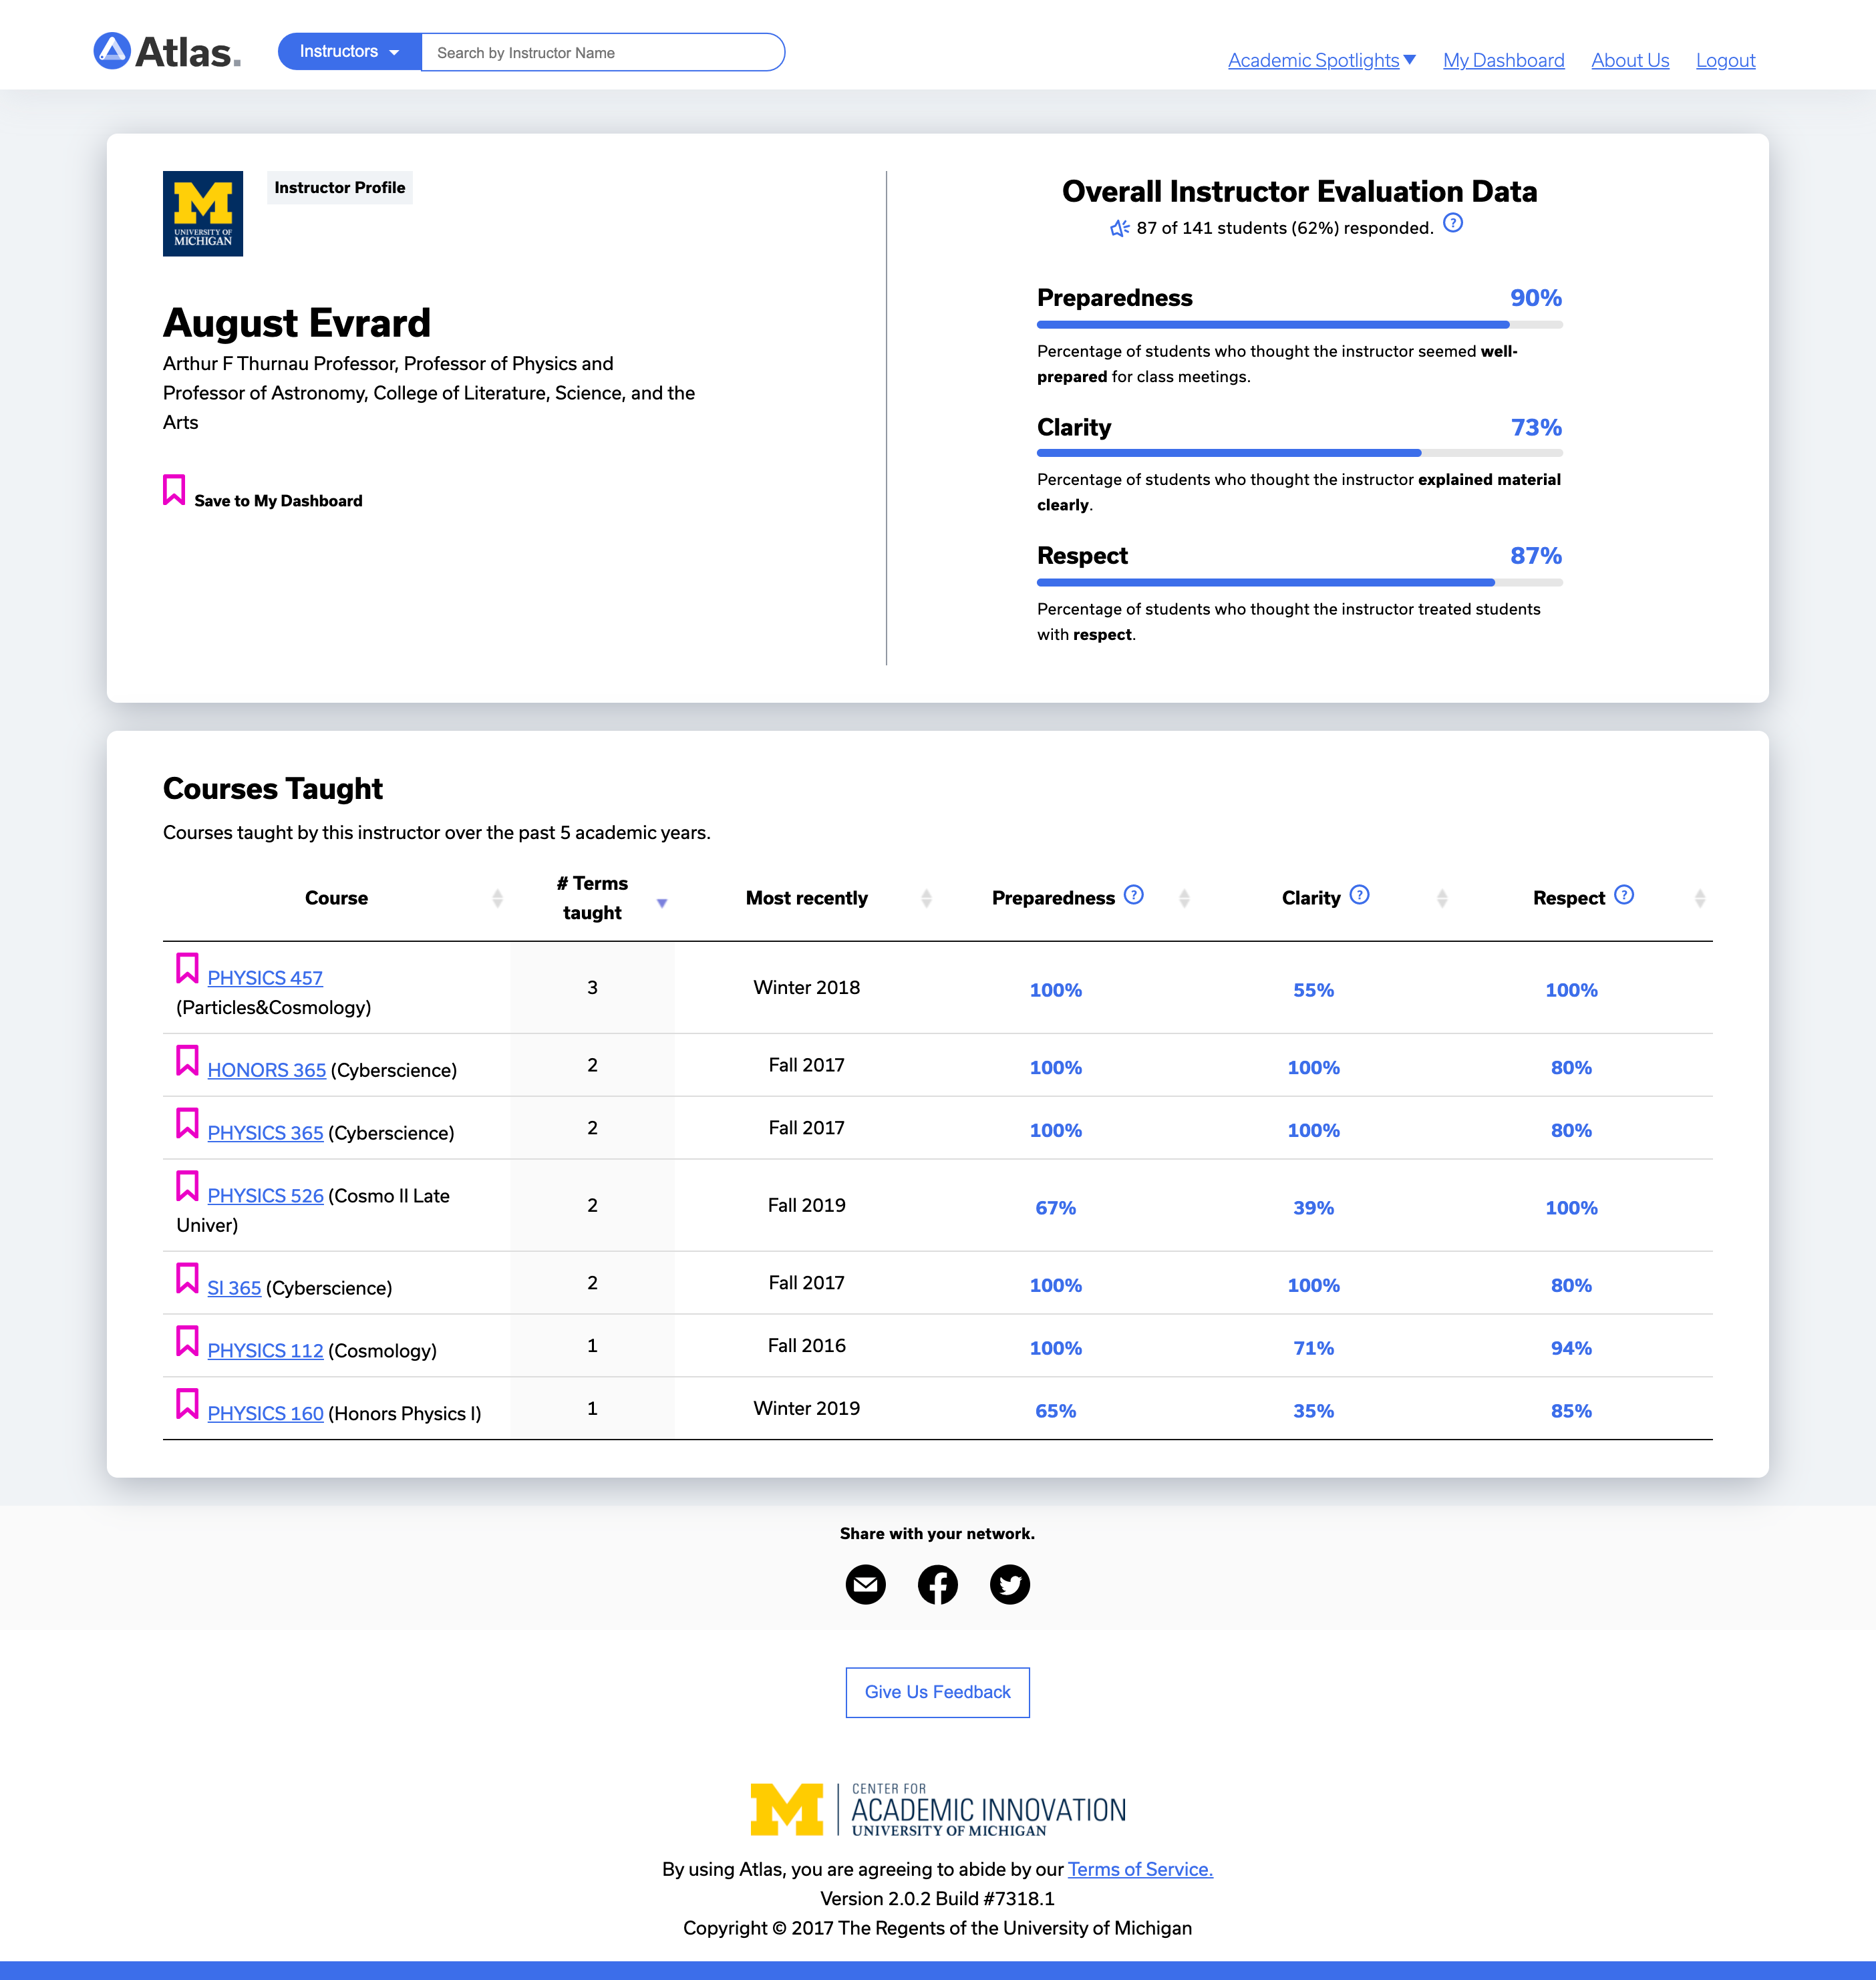
The current instructor profile page contains only a heading with a short instructor’s courses section. The Atlas team wanted to add more useful instructor information to improve the page for UM members.
Atlas Solution
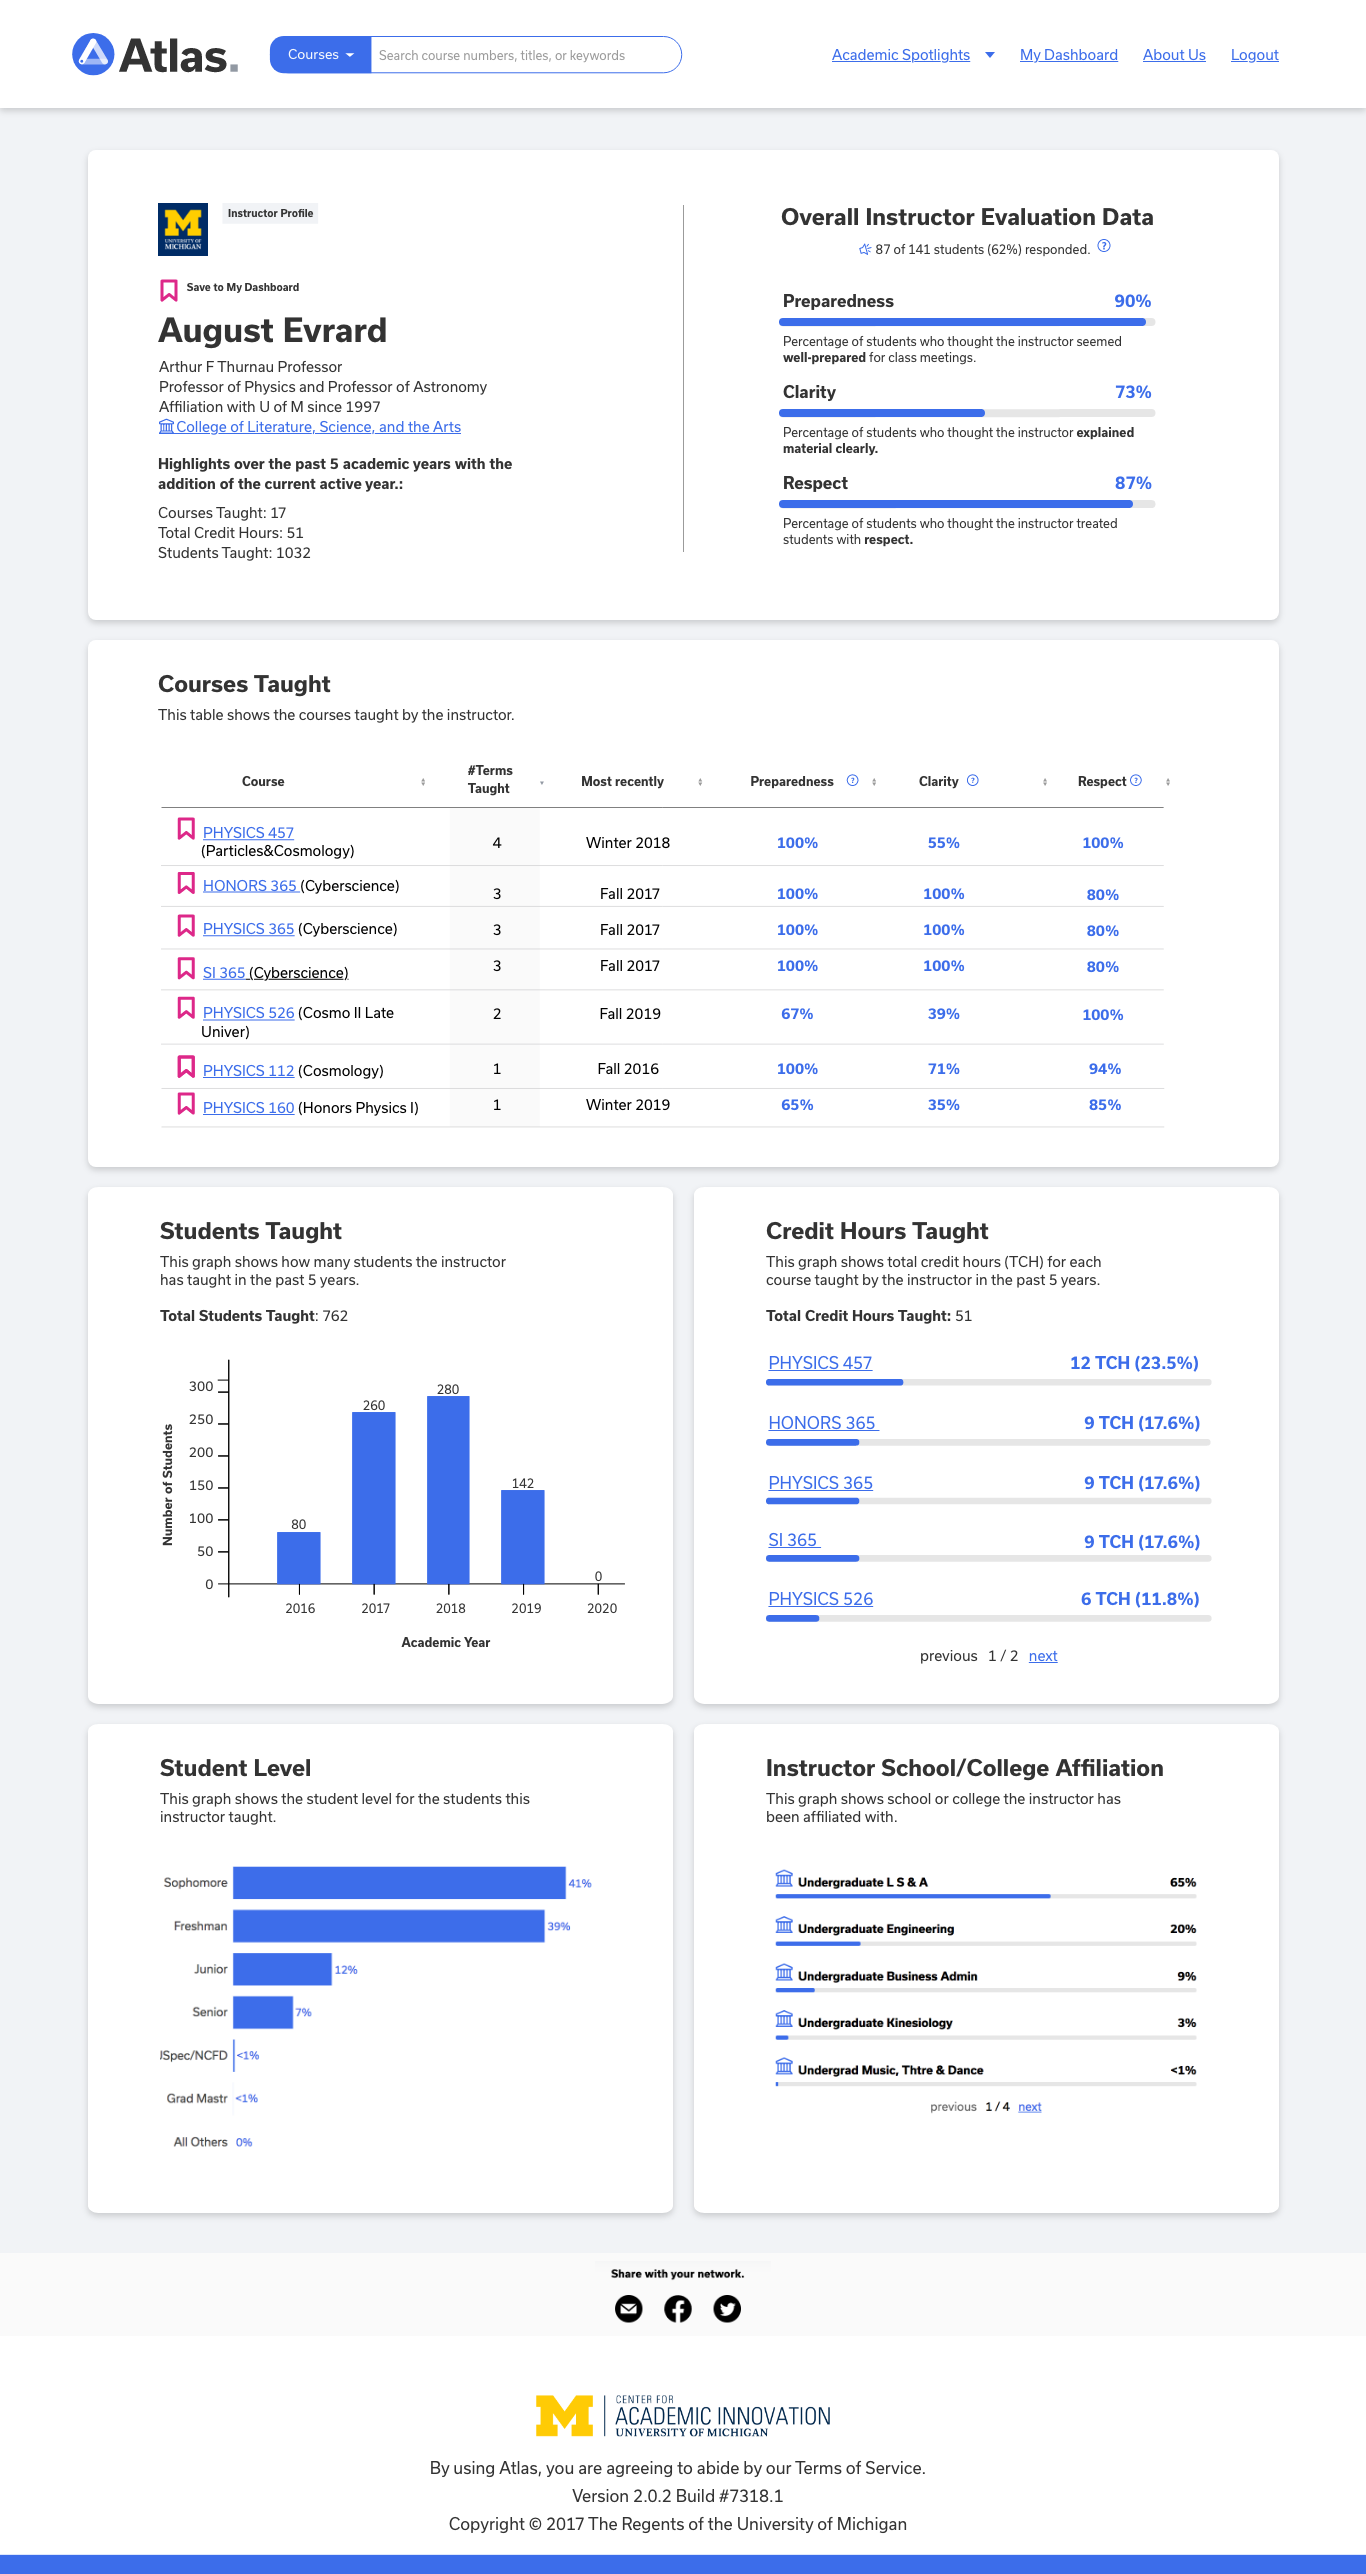
Add five new sections based on the users’ needs and the team’s feedback. The five sections are “Credit Hours Taught,” “Instructor School/College Affiliation,” “Students Taught,” “Student Level,” and “Student Declared Degrees.”
Process
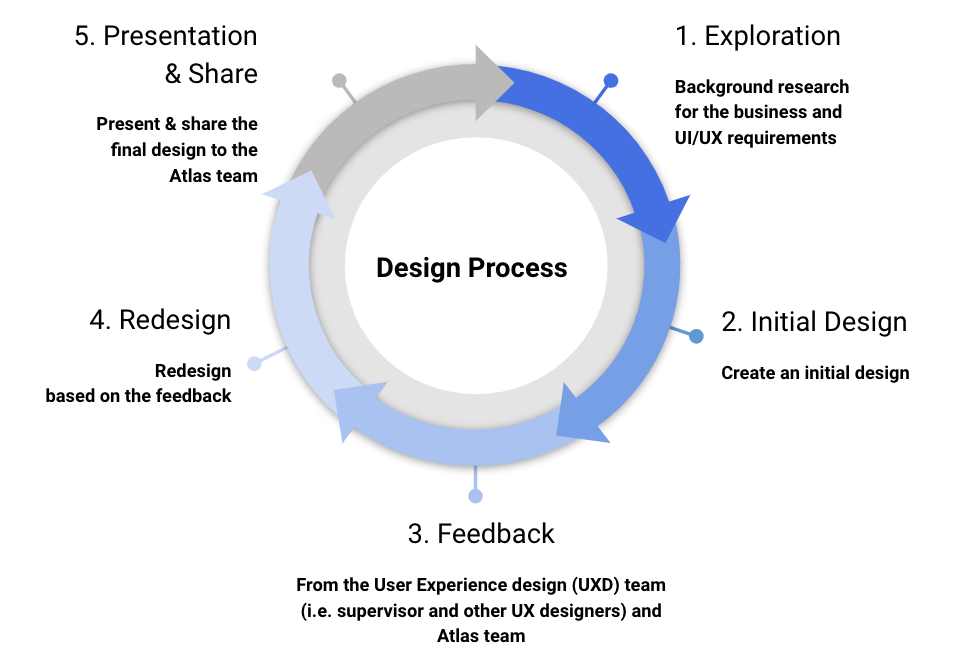
For this project, I followed a design process like below: 1. Exploration, 2. Initial Design, 3. Feedback, 4. Redesign, and 5. Presentation & Share.
1. Exploration
As I mentioned in the Introduction section, the current instructor profile page had little information regarding the instructor. To improve the page, I first explored what additional information the UM students, faculty, and staff would like to see on the page. I interviewed three students for their feedback about the current page and asked what additional information they would like to see. Also, I asked my course professor about his opinion on the page and what data he hoped to check as an instructor. Also, I asked the Atlas team about their thoughts on the current page and discussed how to improve it.
Based on the interviews and the meeting, I gathered users’ needs & business requirements and started to work on the initial design.
2. Initial Design
In the initial design, I created two prototypes. One prototype was with two additional sections, the “Students Taught” and “Course Hours Taught” section, that developers could implement in a short time. Another prototype was with the four additional sections, “Students Taught,” “Course Hours Taught,” “Student Level,” and “Instructor School/College Affiliation” section that could take a little more time to implement but met most of the users’ needs. While working on the design, I followed the current UI patterns, typography, and structure for consistency across the Atlas pages. However, I explored a new approach to display data to improve the page at the same time. For example, I used a vertical bar graph to display “Studnet Taught” data because it helped users to check each data by a year much easier.
3. Feedback
I presented my designs first to the User Experience design (UXD) team (my supervisor and other UX designers) and asked for feedback. I got some positive feedback that displaying data in a vertical graph made sense for the “Student Taught” section, and the design followed a consistent structure with the other Atlas pages. Also, I got a tip from my supervisor that when presenting my designs to the other team and stakeholders, it was always good to prepare rationalization and use cases to defend my designs. After I prepared rationalization and use cases for the new designs, I presented them to the Atlas team and asked for feedback. One of the feedback was that it might be good to display the “Studnet Taught” section by semesters to compare the data not only by a year but also by a semester. The team also asked to add the “Student Declared Degrees” section on the page, which would display what degree students, who took one or more courses that the instructor has taught, eventually declared. This would be particularly useful when an instructor wanted to check what degrees the students finally declared after taking the instructor’s course and when a student wanted to check what majors the other classmates most likely took.
4. Redesign
Based on the feedback, I redesigned the instructor profile page. For example, I updated the “Students Taught” section by semesters with the four colors used in a semester graph on the other Atlas pages. Besides, I added a bookmark icon next to each course and major to save them, which matched with the other Atlas pages’ UI/UX interaction. Also, I reordered each section based on the importance and similarity. For instance, I put course-related sections on the top and put students related sections on the bottom.
5. Presentation & Share
After the redesign, I presented it to the Atlas team and shared my final prototype with the software developers.
Outcome
I successfully added five new section designs that met users’ needs and business requirements in the new instructor profile page. Also, I incorporated feedback from the team into my final prototype. Software developers will start to update the instructor profile page from the next development iteration.
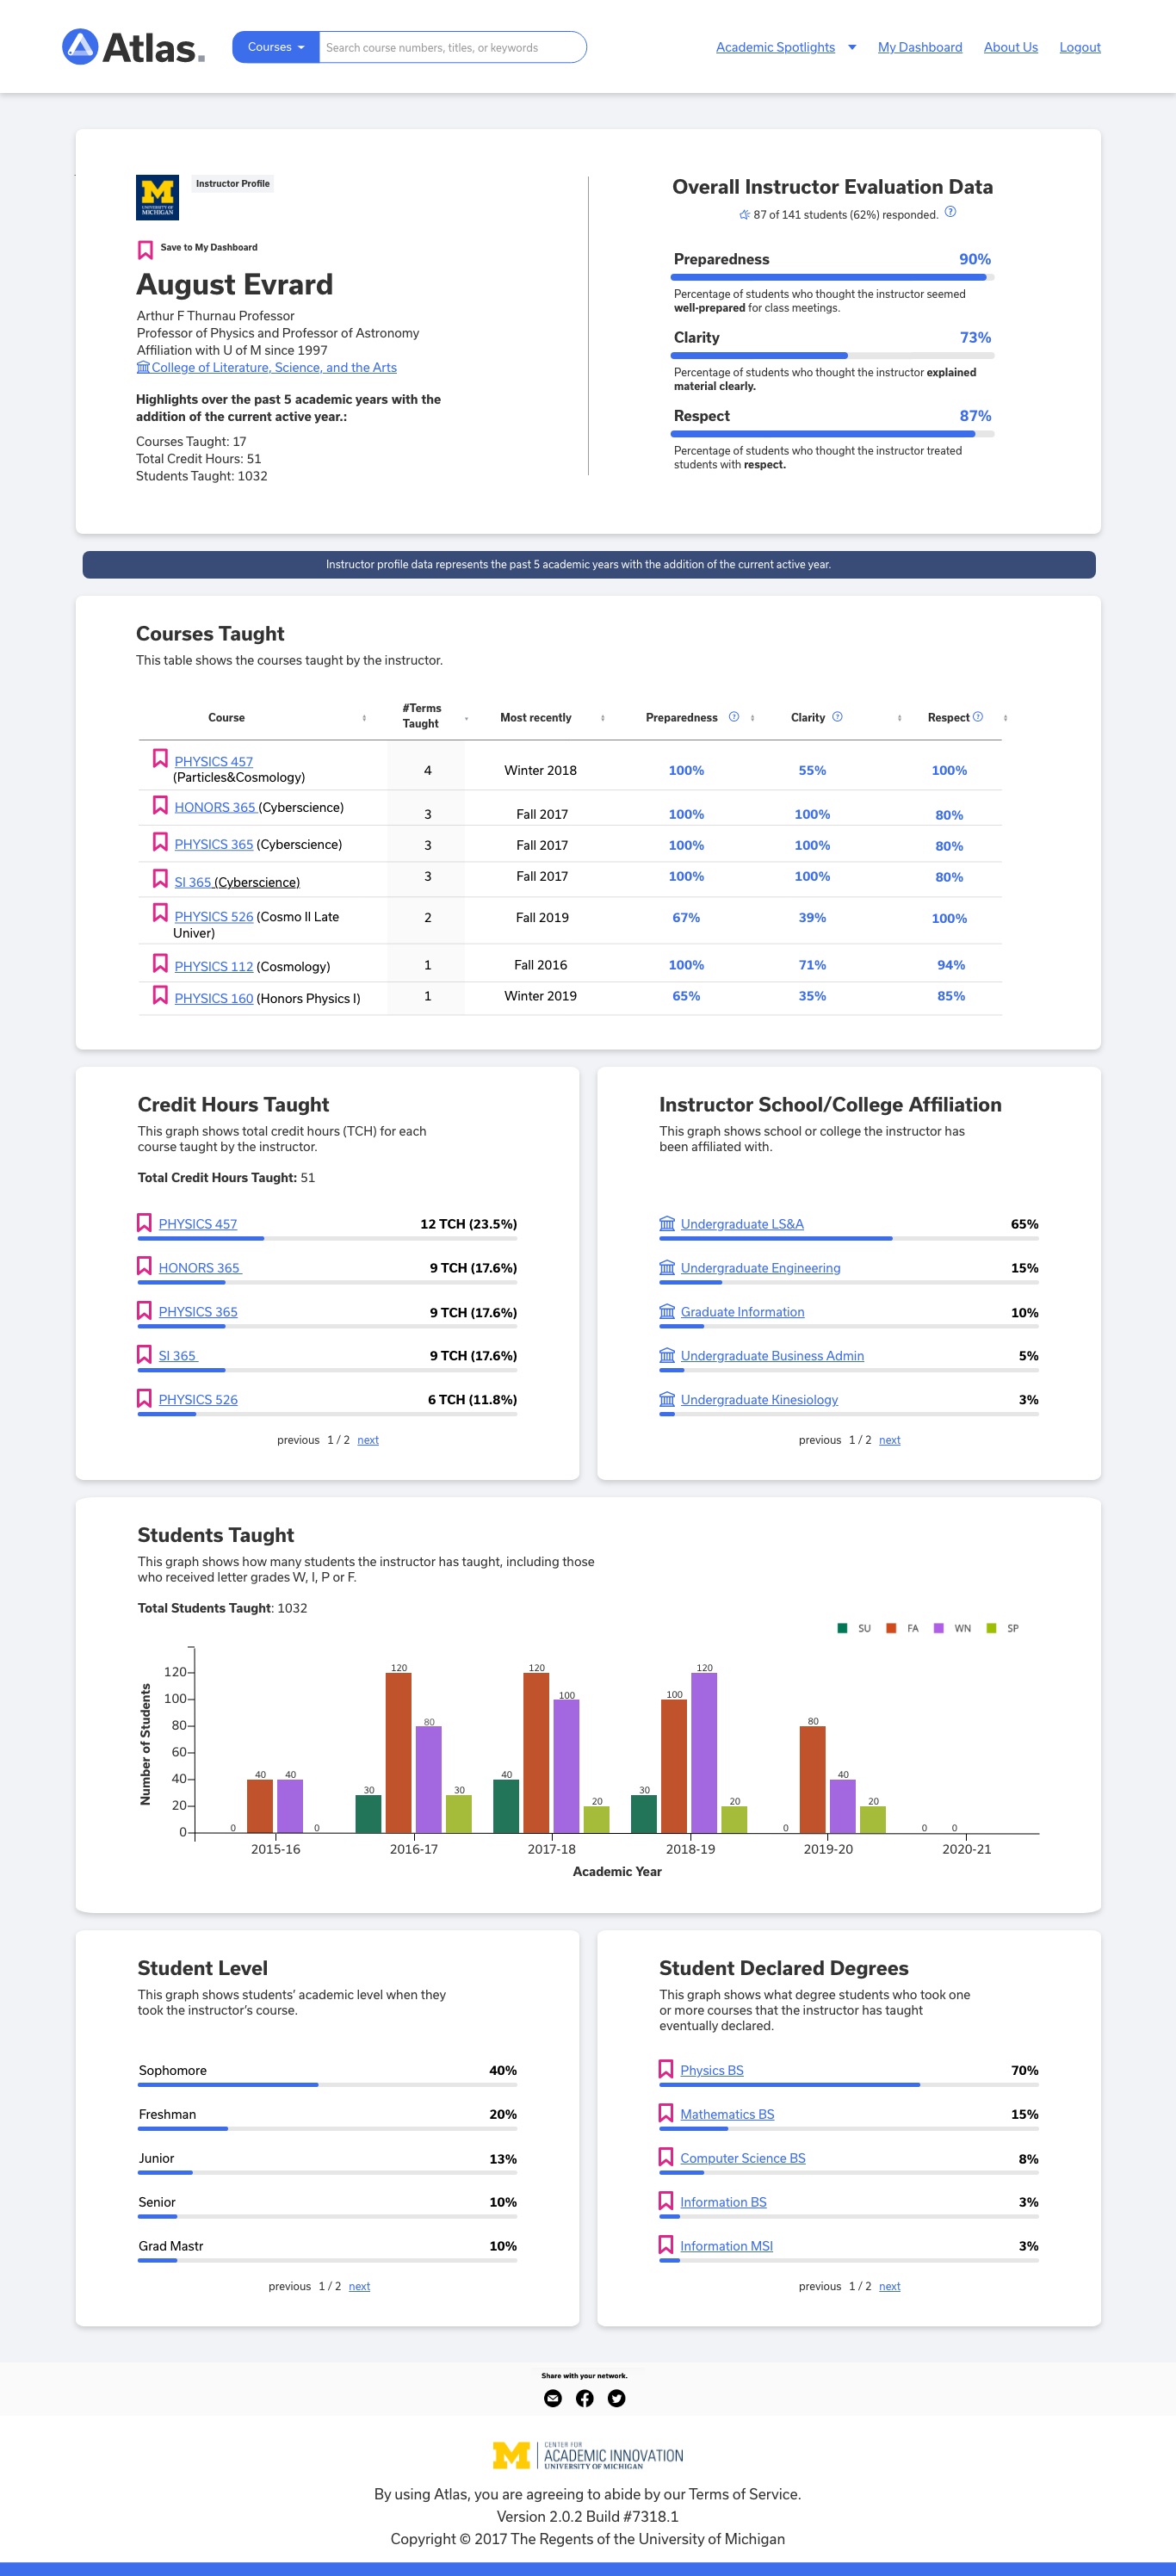
Note: For your reference, to get to an instructor profile page (i.e., Professor August Evrard) on Atlas, a user will first login, search for the instructor on the search bar, and will get to the instructor profile page.
Takeaway
It was an interesting project to improve the current page based on the business requirements and users' needs. One of the biggest takeaways from this project was that I learned how to rationalize my designs and use cases for the new designs. For example, for the "Students Taught" section, I wrote down some use cases and users' benefits.
Student Taught Section
-
Students
- A student may want to see how many students the instructor has taught when the student wants to check if the instructor has a lot of teaching experience.
- A student may want to check this section when the student wants to know if the instructor will have enough time to spend with each student.
-
Instructor
- When an instructor reflects on previous and current teaching experiences, the instructor can check how many students the instructor has taught by years (or by semesters). This helps the instructor understand each year's workload (or each semester's workload) and reflects how the teaching experience was based on the number of students the instructor taught.
-
Additional
- There may be a concern if students have a negative impression when an instructor has taught fewer students than other instructors. However, because the graph's vertical size is fixed while the vertical graph's measure (Number of Students) changes from instructor to instructor, the Students Taught graph might not give users negative impressions. For example, if an instructor has taught 1,000 students, the vertical measure (Number of Students) will be min 0 to max 1,000. On the other hand, if an instructor has taught 100 students, the vertical measure (Number of Students) will be min 0 to max 100. However, the vertical size of the graph is fixed regardless of the number of students taught. The graph helps users compare the same instructor's student taught by a year or a semester but not compare with other instructors.
